The visual acuity chart is also the primary and necessary step for patients to undergo eye examinations. People usually read the vision values marked on the chart directly, but how does its design principle work? What is the relationship between the vision values of 1.0 and 4.0? Today, we will uncover the "story" behind this seemingly simple visual acuity chart.
First of all, we need to clarify the concept of perspective. For a real eye, the perspective should be the angle formed by the two ends of the object and the point in front of it.
The size of the perspective is related not only to the actual size of the object but also to the distance between the object and the eye. At the same time, the perspective can reflect the size of the retinal image. The larger the perspective, the larger the corresponding retinal image; the smaller the perspective, the smaller the corresponding retinal image.
The minimum resolution angle is a threshold concept, which is the perspective formed by the two points outside the object and the node of the eye that the eye can just distinguish. If the perspective formed by the external object and the node of the eye is greater than the minimum resolution angle, it can be distinguished; if it is less, it cannot be distinguished.
The minimum resolution angle for most people with normal vision is 1' of an angle. However, for those with refractive errors, the minimum resolution angle varies. It should be noted that the two are different: the former is affected by h and d, while the latter is a fixed value for each individual.
Vision mainly refers to the ability of the eyes to distinguish the shapes and positions of two-dimensional/plane objects, and is generally expressed by the reciprocal of the minimum resolution angle.
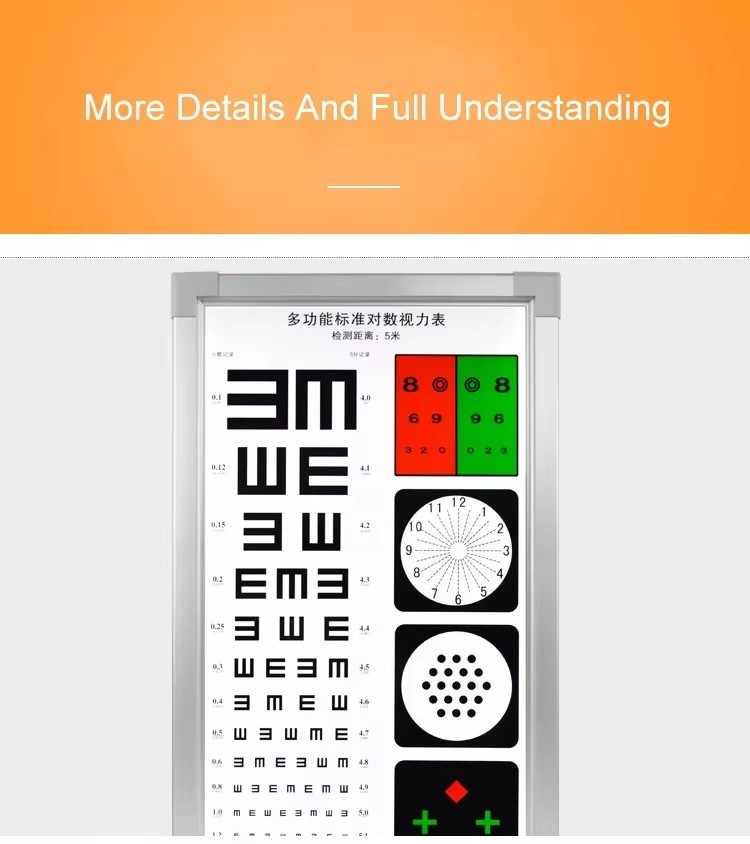
The visual targets can have various patterns, such as Konig rods, C rings/landolt rings, English letters, etc. The most commonly used one is the E-shaped target. Here, we present two types: the E-shaped target with three equally long horizontal lines and the E-shaped target with three horizontally unequal lines.
The most important principle in the design of the visual acuity chart is the five-times-one principle, which means: the size of the visual target is 5-degree visual angle, and the width and gap of the strokes are both 1-degree visual angle.
At the same time, two important distances should be clearly defined - the design distance and the inspection distance. The design distance is based on the five times and one tenth principle. The distance corresponding to each visual target on the vision chart is called the design distance of that visual target. As shown in the figure, the left side of the first row of visual targets has already marked the design distance as 50 meters, which means that the angle formed by this visual target and the eye node at a distance of 50 meters is 5′, and the width of the stroke and the gap form an angle of 1′.
The inspection distance/standard distance refers to the single inspection distance specified by the vision chart. For example, in China, far vision is usually checked at a distance of 5 meters, while in other countries, it is often checked at a distance of 6 meters/20 feet, etc.
The distribution of the visual targets should meet the above two conditions. The most ideal situation is that the magnification is constant (the ratio of the sizes of adjacent two rows of visual targets is a constant) and the interval is appropriate (the interval between adjacent two rows of visual targets is appropriate).
As mentioned earlier, vision = 1/minimum resolution angle. Combined with the design principle of the vision chart, the vision value corresponding to the visual target on the vision chart = inspection distance d / design distance D. This is also called the score recording method of vision.
Currently, the most widely used is the logarithmic vision chart, which mainly features that the size of the visual targets is sorted in a geometric (equal ratio) series, and the five-point vision values are sorted in an arithmetic (equal difference) series. Any vision chart that meets these conditions can be called a logarithmic vision chart.
The ETDRS vision chart is generally used in clinical research and other aspects, and requires the use of visual angle logarithmic vision recording method.